What is this about
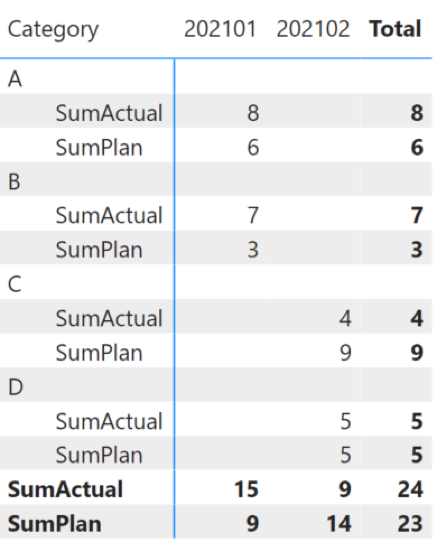
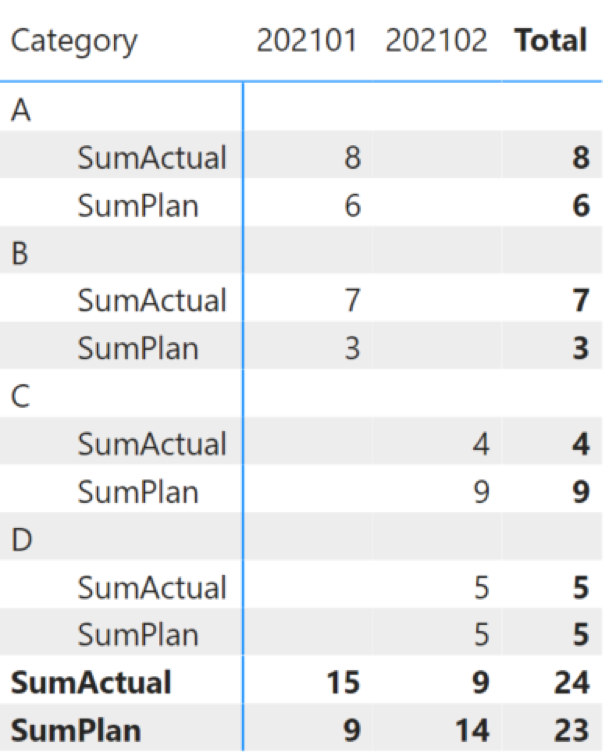
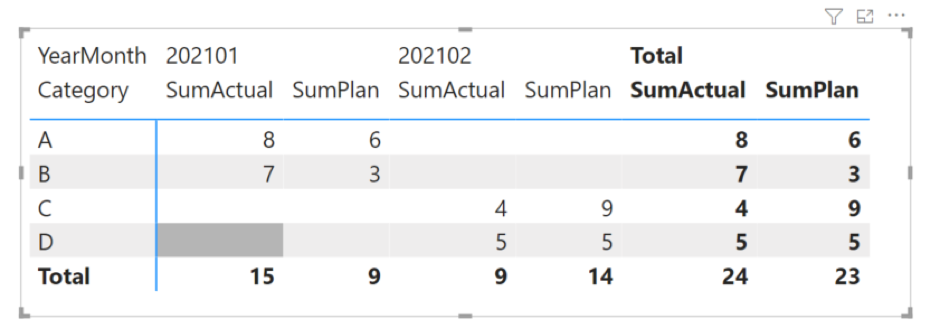
There are a lot of situations you can meet while working with Power BI. One of these situations is that you need to have your measures in rows (not in columns as default). See picture below.
How to do that
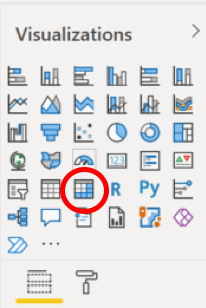
I suppose you have prepared data sources and created model in Power BI. Choose matrix in Power BI desktop.
Next step is to create measures and insert the fields into the matrix.
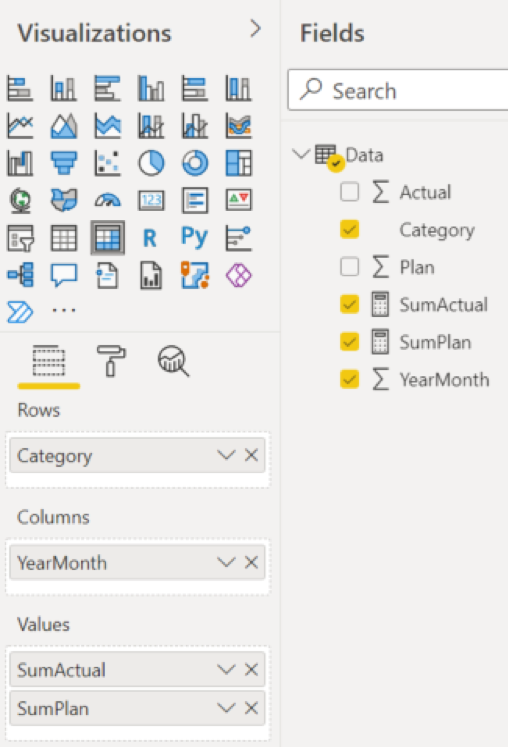
When you do the step before, you get the following output:
But you want to have measures in rows not to columns. So, go to the “Format pane”.
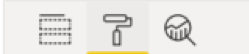
Continue to follow the values.
 And enable “Show on rows”.
And Voilá! After this step you will have your wished visual. 🙂