The purpose of this post is to briefly introduce Test Automation Base Camp, a workshop for testers, which Tomas Pribyl and I attended on the 2nd and 3rd of November, 2019.
During the beautiful weekend of November 2nd and 3rd 2019, Tomáš Přibyl and I attended the Test Automation Base Camp, which took place in our offices at Joyful Craftsmen. Test Automation Base Camp is designed to unify the basic knowledge of all Automated Testers. The goal is to broaden the tester’s horizons.
The motto of the event is:
„It is not important to be an expert in all aspects of test automation.
But it is important to know the reasons and the ways.“
Over the weekend, we were to learn how to work with Git without a GUI, know how to use Docker, and know the benefits of rotating tests. In addition to the tools, we also learned how the Web browser works, and how functional and non-functional tests look (performance and web performance tests). At Joyful Craftsmen we test mainly BI solutions, so we really learned a lot of new things.
On Saturday we met at 9 am, starting with a good breakfast, and then the lecturer Radim Daniel Pánek began to share his knowledge. At the end of the workshop, on Sunday evening, we were glad that the weekend was coming to an end, and we had a final exam. Each of us was awarded a diploma at the end.

The whole weekend was really challenging, but we learned a lot of information. In this article, I would like to briefly introduce the part that interested me most – Performance tests.
Why Performance Tests? These tests provide us with information on application stability and speed, making sure software applications work well on the expected workload. It is also important to test response time, reliability and stability of the application. With Performance tests we uncover bugs, eliminate performance bottlenecks, and see what needs to be improved before the app goes into production.
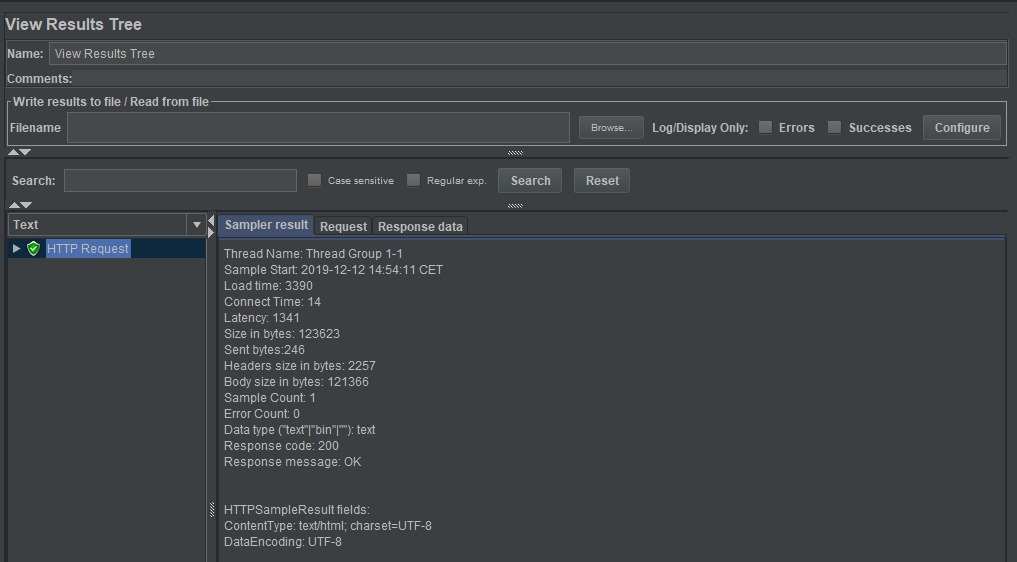
During the workshop I tried how to create a performance test – I created a non-functional performance test in the tool called Jmeter. I wanted to know if while loading the web page Joyfulcraftsmen.com there is a HTTP response code with value 200 – this means that the HTTP request has succeeded and there is no error. So, in Jmeter I configured the test parameters as Protocol and Server Name. Protocol is in this case http and Server Name joyfulcraftsmen.com.
Jmeter showed me the result of the test: HTTP response code of the page JoyfulCraftsmen.com was really 200. In addition, the result showed other performance statistics. We can see that the load time of the page joyfulcraftsmen.com was 3.4 seconds, which is not the fastest time – load time is the difference between time when request is sent and time when response has been fully received. Connect Time represents the time taken to establish TCP connection with client and server using TCP Handshake, in this case it was 14 milliseconds. JMeter also measures the latency which is the duration between the end of the request and the beginning of the server response – it took 1.3 seconds. Size in bytes shows us total page size in bytes, which means header and body size together. We can also see there is no error in our test. ?

So, this is how we learned the basics of performance tests. I would like to recommend this workshop to all testers who want to broaden their horizons in a relatively short time.
