
a.k.a. when you find out that your company expanded more than you could ever imagine…
Recently I have been in touch with one of our clients who had some issues with map visuals in Power BI – his geographical data were not correctly displayed. I realized that in the past I experienced and solved the exact same issue many times, so I have decided to write down a blog post as it may help some other folks.
Now, what was the issue about?
In the Customer dimension, there were some geo attributes like City, Street, Zip Code, etc. The dimension did not contain the Country attribute because in the data source there were data only for customers from the Czech Republic. When the City was placed into the map visual (Map, Filled map), it ended up showing like below:
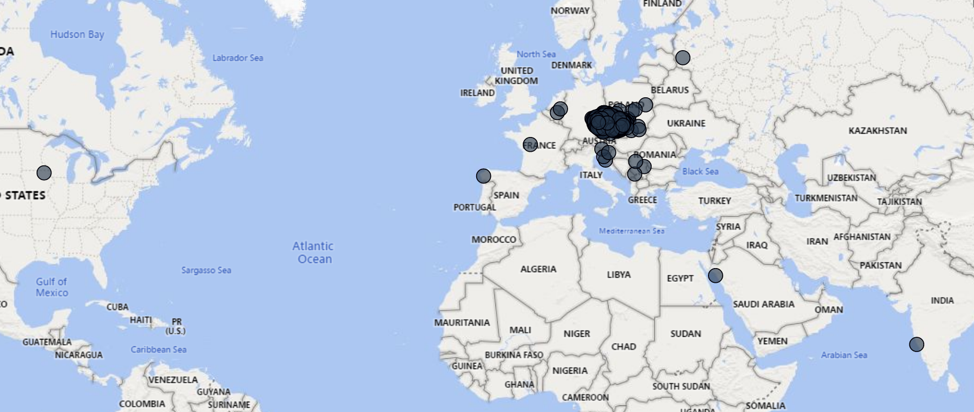
Yeah, Czech cities localized in the USA, Portugal, India, Russia, etc. Funny, right? 😊
If you check the values in more detail and zoom into some obviously odd data point you can see that the value fits the particular place on the map, or at least the place has a very similar name (Měřín is presented as Merín in Portugal, etc.). For instance, if you analyze the pinpointed location in the USA, it shows that there really is a city called Protivin in Iowa. If you google it out, you can learn that this city was actually founded by the Czech settlers.

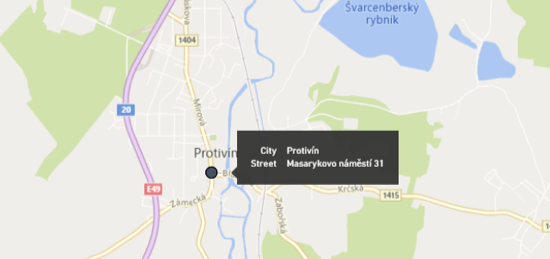
… but it definitely does not reside in the Czech Republic where our client wanted to see it accompanied by the related measures. Another strange thing is, for instance, if you enable the drill-down mode and drill to the street level (with or without a geo hierarchy), it actually transfers you to Protivín in the Czech Republic.
How the heck can I ensure, that it would work on the City level?
Firstly, you may think that the data categorization feature would remedy it. If you do not know what I am talking about, check this out. Once you test it, you’ll see that it does not fix this specific issue, it remains the same. However, data categorization is a really good feature, as it can help with some other potential problems – for example, some geo attributes can have the same value on the State and City level, so you basically signalize to the Power BI how it should be treated. Try it out!
Anyway, I was still stuck with the same issue. Another possible solution was to add an artificial column that would possess information about the Country – the Czech Republic. I have added a Custom column in Power Query Editor to the query that creates a Customer dimension. Afterward, I have added the Country column (you may even apply the Country data category, but it is not necessary for this scenario) to the geo hierarchy and used it in the map visual and voila, it helped. But firstly, you must drill down through the first level of the hierarchy (it would show you only one data point in the visual), in the second level there are all the cities displayed exactly as they should be – all located in the Czech Republic. Even if you drill down to the third level, you get to the correct address of the particular city.
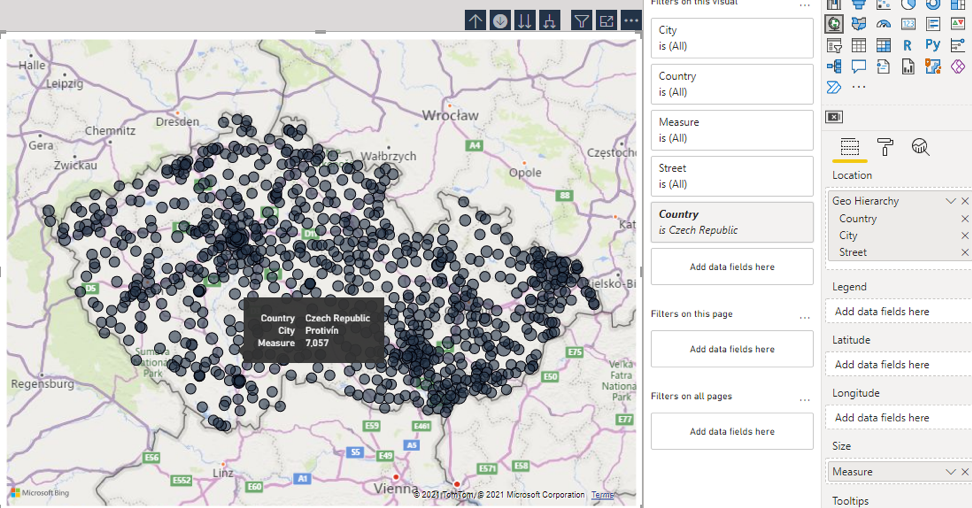
As you can see on the snip above, when you enable the drill-down mode it applies a new visual filter in the Filter pane. So, you may wonder whether it would be possible to use a Country filter either in the slicer or in the filter pane without the usage of the geo hierarchy in the visual – no, it does not help no matter what slicer or filter type in the filter pane you choose. You can see that there are two Country filters utilized in the snip. The second one has been added automatically by the drill-down mode and has clearly different behavior.
In case you work with data for more than one country, you should certainly try to load the Country attribute directly from the data source. Should you not have it in your data source you have to load a mapping table or leverage some logic by which it would be possible to assign the cities to the appropriate country.
Another option might be to enrich the dataset with the longitude and latitude columns. These values would help to narrow down the data points and display the cities in the correct country. In our case, the customer didn‘t have this additional data, and even if so, this approach would be more time-consuming when compared to the one employing the “artificial” country column.
Thus, the final solution was to create a new Country column in the Customer dimension and include it in the visual, either as a standalone column or as a part of the geo hierarchy. This is a super quick fix if you deal with such a problem.
Let me know if you have any better hacks/tips!